Distributed tracing (ULTIMATE SAAS EXPERIMENT)
- Introduced in GitLab 16.2 with flags named
observability_group_tabandobservability_tracing. Disabled by default. This feature is an Experiment.- Feature flag
observability_group_tabremoved in GitLab 16.5.
FLAG:
On GitLab.com, by default this feature is not available.
To make it available, an administrator can enable the feature flag named observability_tracing.
The feature is not ready for production use.
With distributed tracing, you can troubleshoot application performance issues by inspecting how a request moves through different services and systems, the timing of each operation, and any errors or logs as they occur. Tracing is particularly useful in the context of microservice applications, which group multiple independent services collaborating to fulfill user requests.
This feature is an Experiment. For more information, see the group direction page. To leave feedback about tracing bugs or functionality, comment in the feedback issue or open a new issue.
Configure distributed tracing for a project
To configure distributed tracing:
- Create an access token and enable tracing.
- Configure your application to use the OpenTelemetry exporter.
Create an access token and enable tracing
Prerequisites:
- You must have at least the Maintainer role for the project.
To enable tracing in a project:
- On the left sidebar, select Search or go to and find your project.
- Select Settings > Access Tokens.
- Create an access token with the following scopes:
read_api,read_observability,write_observability. - Copy the value of the access token.
- Select Monitor > Tracing.
- Select Enable.
Configure your application to use the OpenTelemetry exporter
Next, configure your application to send traces to GitLab.
To do this, set the following environment variables:
OTEL_EXPORTER = "otlphttp"
OTEL_EXPORTER_OTLP_TRACES_ENDPOINT = "https://observe.gitlab.com/v3/<namespace-id>/<gitlab-project-id>/ingest/traces"
OTEL_EXPORTER_OTLP_TRACES_HEADERS = "PRIVATE-TOKEN=<gitlab-access-token>"
Use the following values:
-
namespace-id: The top-level namespace ID where your project is located. -
gitlab-project-id: The project ID. -
gitlab-access-token: The access token you created previously.
When your application is configured, run it, and the OpenTelemetry exporter attempts to send traces to GitLab.
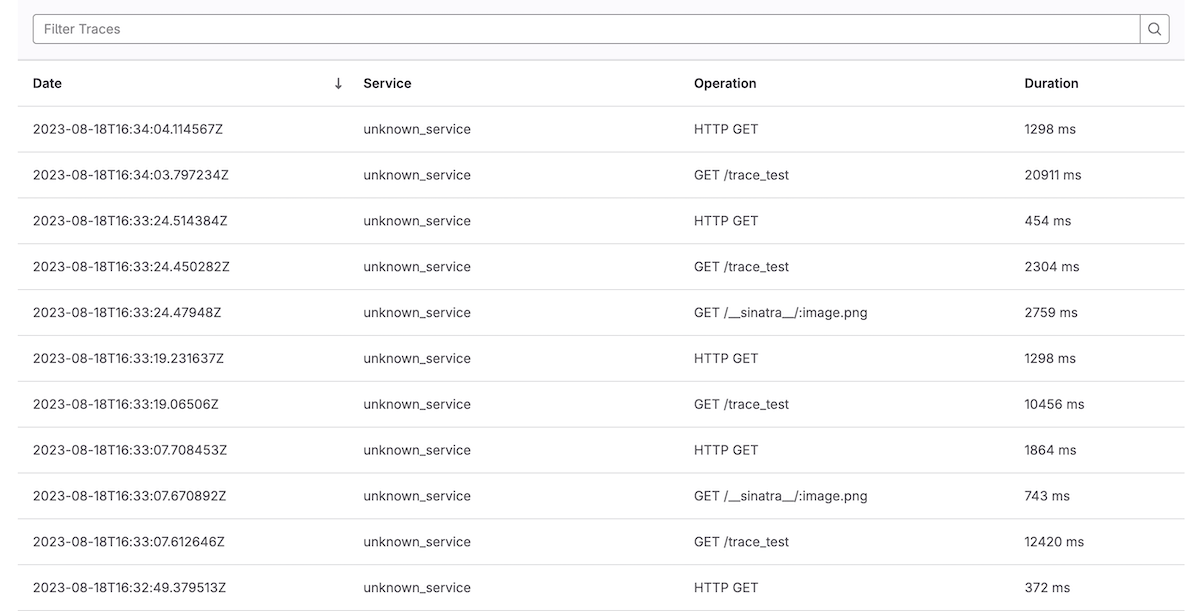
View your traces
If your traces are exported successfully, you can see them in the project.
To view the list of traces:
- On the left sidebar, select Search or go to and find your project.
- Select Monitor > Traces.
To see the details of a trace, select it from the list.